By Priya Bhagavathy and Hannah Budnitz
The UK has a net zero target by 2050, as enshrined in law, and with transport being the largest emitting sector, accelerating electric vehicle (EV) uptake is fundamental to reaching that target. Luckily, the adoption of new technologies is rarely linear; instead, has been shown to follow an S-curve as uptake moves from tech-savvy to mainstream. As part of the Park and Charge Oxfordshire research project, we undertook an S-curve analysis to understand the potential trajectories (see Enabling the Acceleration of Electric Vehicle Adoption (Policy Brief 1, February 2022)).
After a long hiatus from EV uptake analysis, we recently ventured to re-run the s-curve analysis (initially published in December 2021). Unsurprisingly, the data formats and granularity have changed since then. Although this meant an entire rejig of the code, the higher geographical granularity across the datasets meant more regional insights than before. The primary data file includes the cumulative number of electric vehicles and all vehicles by counties from 2010 through Quarter 4, 2023, from the UK Government’s Department for Transport (VEH0105.ods). It was processed using Python.
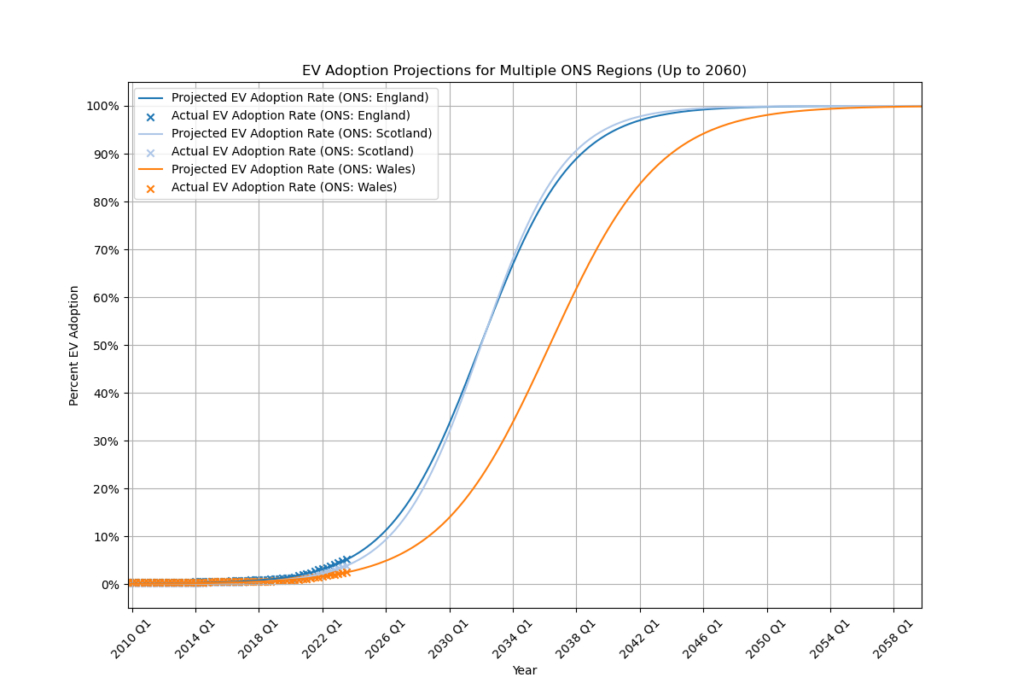
The figure below shows the cumulative EV uptake forecasts for England, Scotland and Wales. As can be seen, EV growth forecasts for Scotland and England are quite similar and the vehicle fleet is on target to be nearly 100% electric by 2045. However, Wales is lagging by almost 8 years.

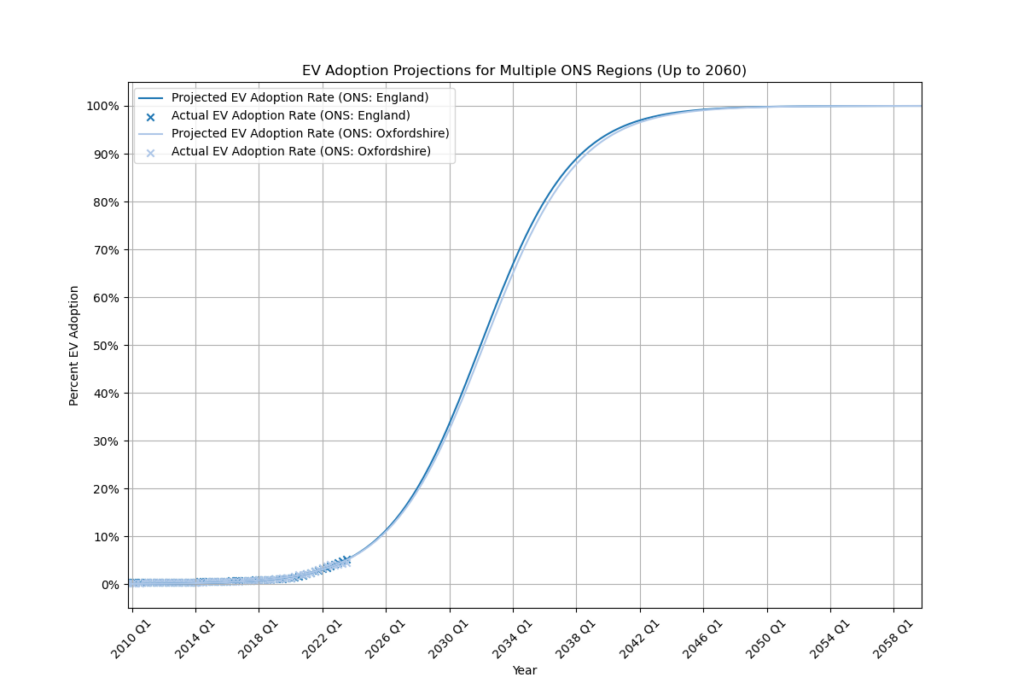
As our initial interest was in Oxfordshire, we plotted the forecasts for England and Oxfordshire, which are also incredibly similar. Then we took advantage of the higher geographic granularity now available to look further within Oxfordshire. We plotted the five district councils (Oxford City Council, Cherwell, South Oxfordshire, Vale of White Horse, and West Oxfordshire). Though initial uptake was slower, Cherwell has picked up the pace in the last 5 years and is leading the way in achieving all EV status sooner than the rest of the districts in the county.


On the other hand, this analysis tells us little about why uptake is faster or slower in different places. We know from other research that commercial fleets and company car schemes are dominating the new EV market in the UK. Cherwell has the highest economic activity rate and the second highest number of jobs in Oxfordshire after Oxford City, where major employers like the University tend to promote non-car commuting. Could this be why they also have higher EV adoption rates?
The S-curve analysis also does not account for external events or national policy changes – until any changes in adoption rates enter historic data.
As can be seen below, when we first started this research in 2019, the time until full adoption was much longer. Then the pandemic and energy crises hit, and the UK government set a 2030 target to end sales of internal combustion engine (ICE) cars and vans.
There has also been substantial investment from the Government and industry in public and private EV charging. Has this pulled the S-curves forward in time, as well as making the exponential growth phase steeper? And what impact has the subsequent push-back of targets and mixed messages had since late 2023? We don’t yet have the data to be able to see any more recent changes in our S-curve analysis.

With the political landscape in the UK altering overnight and the 2030 phase-out date for ICE vehicles potentially back in the frame, the mixed messages may have little to no impact. However, with car dealers reporting that EV sales are still below the Zero Emissions Mandate target, we think our S-curve analysis could help the government in Westminster, local authorities, and industry see where there is still work to do to get adoption on track across the country. Have a look at our online tool for your area of interest and see if you agree!
What do you think? We would welcome questions and comments on the applications of S-curve analysis to EV adoption in the UK, on the influence of different geodemographics or policy changes, and thoughts about avenues for further research. Please respond to this post here or on the cross-post on LinkedIn.